Course header with enroll cardcourse-hero-enroll
Use in Plus UI
npx shadcn@latest add https://blocks.plusui.com/r/course-hero-enroll.jsonCourses · 5 variants
← → to step through · + on a thumbnail to compare side by side (up to 3)

/preview/course-hero-enroll
Open ↗Default content
{
  "breadcrumb": [
    {
      "label": "Courses",
      "href": "/courses"
    },
    {
      "label": "Data",
      "href": "/courses"
    }
  ],
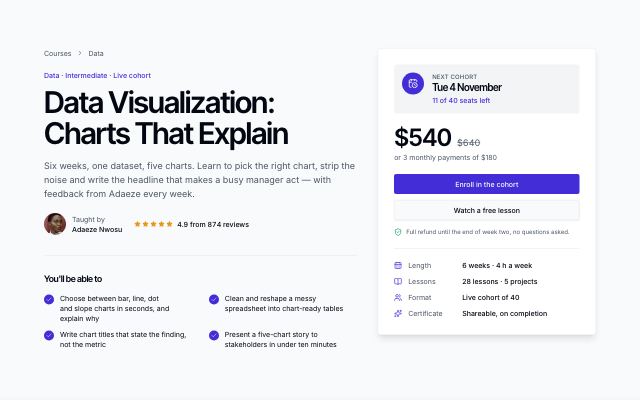
  "eyebrow": "Data · Intermediate · Live cohort",
  "title": "Data Visualization: Charts That Explain",
  "description": "Six weeks, one dataset, five charts. Learn to pick the right chart, strip the noise and write the headline that makes a busy manager act — with feedback from Adaeze every week.",
  "rating": {
    "value": 4.9,
    "label": "4.9 from 874 reviews"
  },
  "outcomesTitle": "You'll be able to",
  "outcomes": [
    "Choose between bar, line, dot and slope charts in seconds, and explain why",
    "Clean and reshape a messy spreadsheet into chart-ready tables",
    "Write chart titles that state the finding, not the metric",
    "Present a five-chart story to stakeholders in under ten minutes"
  ],
  "instructor": {
    "label": "Taught by",
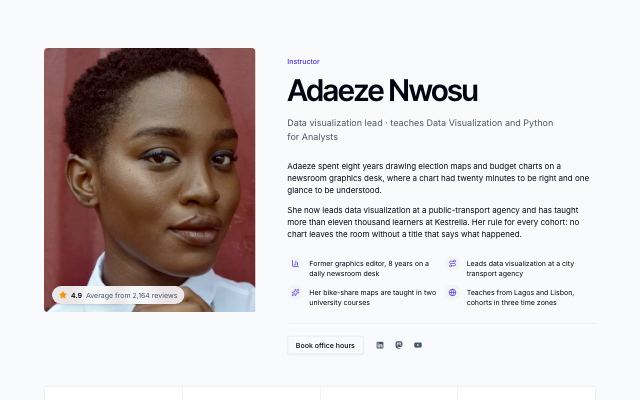
    "name": "Adaeze Nwosu",
    "role": "Data visualization lead, former newsroom graphics editor",
    "portrait": {
      "src": "https://images.unsplash.com/photo-1531123897727-8f129e1688ce?auto=format&fit=crop&crop=faces&w=160&h=160&q=80",
      "alt": "Portrait of Adaeze Nwosu"
    },
    "href": "/instructors/adaeze-nwosu"
  },
  "facts": [
    {
      "icon": "calendar",
      "label": "Length",
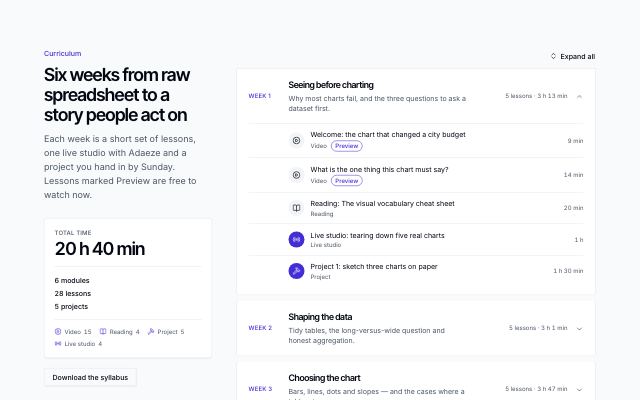
      "value": "6 weeks · 4 h a week"
    },
    {
      "icon": "book",
      "label": "Lessons",
      "value": "28 lessons · 5 projects"
    },
    {
      "icon": "users",
      "label": "Format",
      "value": "Live cohort of 40"
    },
    {
      "icon": "sparkles",
      "label": "Certificate",
      "value": "Shareable, on completion"
    }
  ],
  "enroll": {
    "cohortLabel": "Next cohort",
    "cohortDate": "Tue 4 November",
    "cohortNote": "11 of 40 seats left",
    "currency": "USD",
    "price": 540,
    "compareAt": 640,
    "wasLabel": "Was",
    "freeLabel": "Free",
    "priceNote": "or 3 monthly payments of $180",
    "action": {
      "label": "Enroll in the cohort",
      "href": "#enroll",
      "variant": "primary"
    },
    "secondaryAction": {
      "label": "Watch a free lesson",
      "href": "#curriculum",
      "variant": "secondary"
    },
    "guarantee": "Full refund until the end of week two, no questions asked."
  },
  "build": {
    "label": "What you'll build",
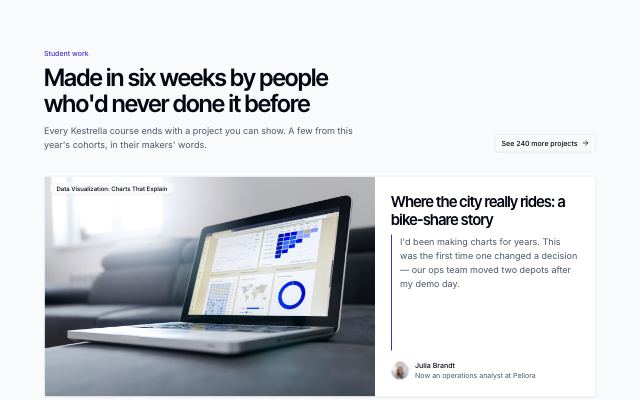
    "title": "A five-chart story from 18 months of city bike-share data",
    "visual": {
      "kind": "chart",
      "title": "Weekday rides by hour, 2025",
      "caption": "Your week-4 project",
      "chart": {
        "title": "Rides started per hour, weekdays",
        "value": "71,400",
        "delta": "Peak at 17:00, not 08:00",
        "points": [
          3,
          2,
          2,
          5,
          16,
          48,
          86,
          67,
          42,
          36,
          39,
          43,
          42,
          46,
          57,
          81,
          98,
          72,
          46,
          31,
          21,
          12
        ],
        "labels": [
          "00:00",
          "04:00",
          "08:00",
          "12:00",
          "16:00",
          "20:00"
        ]
      }
    }
  }
}