Curriculum with module accordioncurriculum-modules
Use in Plus UI
npx shadcn@latest add https://blocks.plusui.com/r/curriculum-modules.jsonCourses · 5 variants
← → to step through · + on a thumbnail to compare side by side (up to 3)
/preview/curriculum-modules
Open ↗Default content
{
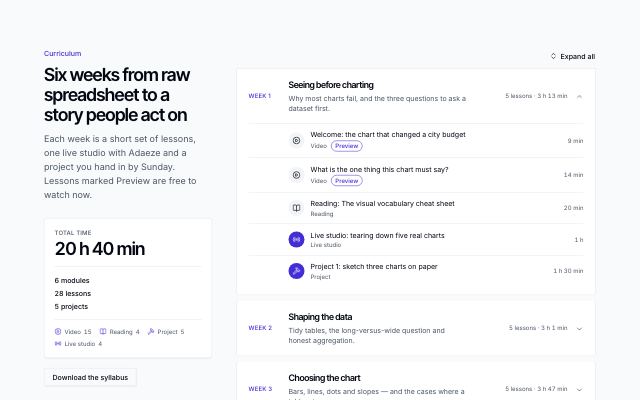
  "eyebrow": "Curriculum",
  "title": "Six weeks from raw spreadsheet to a story people act on",
  "description": "Each week is a short set of lessons, one live studio with Adaeze and a project you hand in by Sunday. Lessons marked Preview are free to watch now.",
  "typeLabels": {
    "video": "Video",
    "reading": "Reading",
    "project": "Project",
    "live": "Live studio"
  },
  "previewLabel": "Preview",
  "lessonsLabel": "{count} lessons",
  "modulesLabel": "{count} modules",
  "projectsLabel": "{count} projects",
  "durationFormat": {
    "hours": "{h} h",
    "minutes": "{m} min",
    "both": "{h} h {m} min"
  },
  "totalLabel": "Total time",
  "expandAllLabel": "Expand all",
  "collapseAllLabel": "Collapse all",
  "action": {
    "label": "Download the syllabus",
    "href": "#",
    "variant": "secondary"
  },
  "modules": [
    {
      "label": "Week 1",
      "title": "Seeing before charting",
      "summary": "Why most charts fail, and the three questions to ask a dataset first.",
      "lessons": [
        {
          "title": "Welcome: the chart that changed a city budget",
          "type": "video",
          "minutes": 9,
          "preview": true
        },
        {
          "title": "What is the one thing this chart must say?",
          "type": "video",
          "minutes": 14,
          "preview": true
        },
        {
          "title": "Reading: The visual vocabulary cheat sheet",
          "type": "reading",
          "minutes": 20
        },
        {
          "title": "Live studio: tearing down five real charts",
          "type": "live",
          "minutes": 60
        },
        {
          "title": "Project 1: sketch three charts on paper",
          "type": "project",
          "minutes": 90
        }
      ]
    },
    {
      "label": "Week 2",
      "title": "Shaping the data",
      "summary": "Tidy tables, the long-versus-wide question and honest aggregation.",
      "lessons": [
        {
          "title": "Tidy data in twelve minutes",
          "type": "video",
          "minutes": 12,
          "preview": true
        },
        {
          "title": "Pivot, unpivot and when to stop",
          "type": "video",
          "minutes": 18
        },
        {
          "title": "Averages that lie, and medians that don't",
          "type": "video",
          "minutes": 16
        },
        {
          "title": "Reading: A field guide to messy dates",
          "type": "reading",
          "minutes": 15
        },
        {
          "title": "Project 2: clean the bike-share export",
          "type": "project",
          "minutes": 120
        }
      ]
    },
    {
      "label": "Week 3",
      "title": "Choosing the chart",
      "summary": "Bars, lines, dots and slopes — and the cases where a table wins.",
      "lessons": [
        {
          "title": "Comparison: bars, dots and the zero line",
          "type": "video",
          "minutes": 17
        },
        {
          "title": "Change over time without spaghetti",
          "type": "video",
          "minutes": 19
        },
        {
          "title": "Part-to-whole: why we skip the pie",
          "type": "video",
          "minutes": 11
        },
        {
          "title": "Live studio: chart choice clinic",
          "type": "live",
          "minutes": 60
        },
        {
          "title": "Project 3: three charts, one question",
          "type": "project",
          "minutes": 120
        }
      ]
    },
    {
      "label": "Week 4",
      "title": "Colour, labels and annotation",
      "summary": "Spend colour like money, label directly and write titles that state the finding.",
      "lessons": [
        {
          "title": "One accent colour and a lot of grey",
          "type": "video",
          "minutes": 15
        },
        {
          "title": "Direct labels beat legends",
          "type": "video",
          "minutes": 10
        },
        {
          "title": "Headlines that say what happened",
          "type": "video",
          "minutes": 13
        },
        {
          "title": "Reading: Accessible colour in practice",
          "type": "reading",
          "minutes": 18
        },
        {
          "title": "Project 4: the rush-hour chart",
          "type": "project",
          "minutes": 150
        }
      ]
    },
    {
      "label": "Week 5",
      "title": "From charts to a story",
      "summary": "Sequence five charts so each one answers the question the last one raised.",
      "lessons": [
        {
          "title": "The five-chart story structure",
          "type": "video",
          "minutes": 21
        },
        {
          "title": "Writing the paragraph between charts",
          "type": "video",
          "minutes": 14
        },
        {
          "title": "Live studio: peer review in pairs",
          "type": "live",
          "minutes": 75
        },
        {
          "title": "Project 5: draft your story",
          "type": "project",
          "minutes": 180
        }
      ]
    },
    {
      "label": "Week 6",
      "title": "Presenting and shipping",
      "summary": "Present in ten minutes, handle the tough question and publish your portfolio piece.",
      "lessons": [
        {
          "title": "Ten minutes, five charts, one decision",
          "type": "video",
          "minutes": 16
        },
        {
          "title": "Answering 'but is this significant?'",
          "type": "video",
          "minutes": 12
        },
        {
          "title": "Demo day: present to the cohort",
          "type": "live",
          "minutes": 90
        },
        {
          "title": "Publish your case study",
          "type": "reading",
          "minutes": 25
        }
      ]
    }
  ]
}