Instructor profileinstructor-profile
Use in Plus UI
npx shadcn@latest add https://blocks.plusui.com/r/instructor-profile.jsonCourses · 5 variants
← → to step through · + on a thumbnail to compare side by side (up to 3)
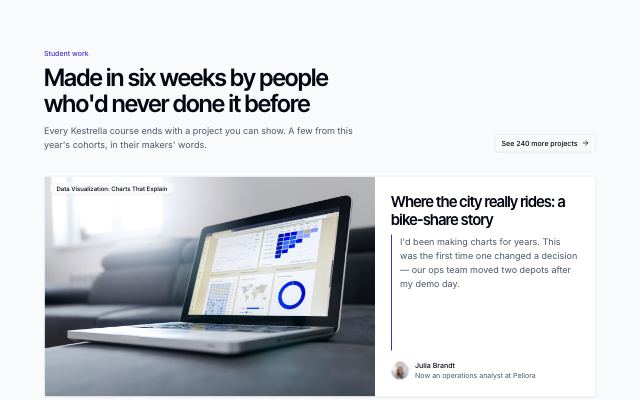
/preview/instructor-profile
Open ↗Default content
{
  "eyebrow": "Instructor",
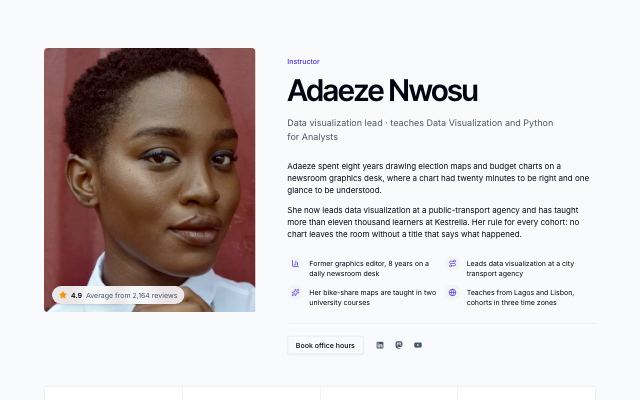
  "name": "Adaeze Nwosu",
  "role": "Data visualization lead · teaches Data Visualization and Python for Analysts",
  "portrait": {
    "src": "https://images.unsplash.com/photo-1531123897727-8f129e1688ce?auto=format&fit=crop&crop=faces&w=640&h=640&q=80",
    "alt": "Portrait of Adaeze Nwosu"
  },
  "bio": [
    "Adaeze spent eight years drawing election maps and budget charts on a newsroom graphics desk, where a chart had twenty minutes to be right and one glance to be understood.",
    "She now leads data visualization at a public-transport agency and has taught more than eleven thousand learners at Kestrella. Her rule for every cohort: no chart leaves the room without a title that says what happened."
  ],
  "stats": [
    {
      "value": "11,480",
      "label": "learners taught"
    },
    {
      "value": "14",
      "label": "cohorts led"
    },
    {
      "value": "93%",
      "label": "finish their project"
    }
  ],
  "rating": {
    "value": 4.9,
    "label": "Average from 2,164 reviews"
  },
  "highlights": [
    {
      "icon": "chart",
      "text": "Former graphics editor, 8 years on a daily newsroom desk"
    },
    {
      "icon": "route",
      "text": "Leads data visualization at a city transport agency"
    },
    {
      "icon": "sparkles",
      "text": "Her bike-share maps are taught in two university courses"
    },
    {
      "icon": "globe",
      "text": "Teaches from Lagos and Lisbon, cohorts in three time zones"
    }
  ],
  "social": [
    {
      "label": "Adaeze Nwosu on LinkedIn",
      "href": "#",
      "icon": "linkedin"
    },
    {
      "label": "Adaeze Nwosu on Mastodon",
      "href": "#",
      "icon": "mastodon"
    },
    {
      "label": "Adaeze Nwosu on YouTube",
      "href": "#",
      "icon": "youtube"
    }
  ],
  "contact": {
    "label": "Book office hours",
    "href": "#",
    "variant": "secondary"
  },
  "quote": {
    "text": "Adaeze marked up my week-three chart with eleven tiny notes. Every one of them was right, and the final version went straight into our board deck.",
    "author": "Julia Brandt, operations analyst",
    "course": "Data Visualization: Charts That Explain"
  },
  "coursesTitle": "Courses Adaeze teaches",
  "currency": "USD",
  "courses": [
    {
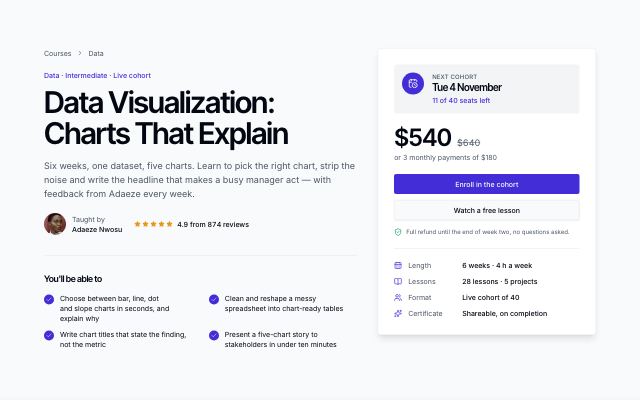
      "title": "Data Visualization: Charts That Explain",
      "href": "/courses/data-visualization",
      "topic": "Data",
      "level": "intermediate",
      "format": "cohort",
      "summary": "Turn a messy spreadsheet into a five-chart story a busy manager understands in a minute.",
      "cover": {
        "src": "https://images.unsplash.com/photo-1460925895917-afdab827c52f?auto=format&fit=crop&w=800&h=600&q=80",
        "alt": "A laptop on a desk showing an analytics dashboard"
      },
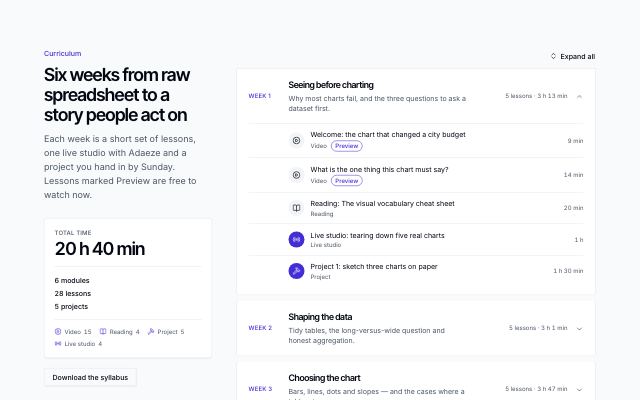
      "weeks": 6,
      "lessons": 28,
      "price": 540,
      "rating": {
        "value": 4.9,
        "count": 874
      },
      "instructor": {
        "name": "Adaeze Nwosu",
        "portrait": {
          "src": "https://images.unsplash.com/photo-1531123897727-8f129e1688ce?auto=format&fit=crop&crop=faces&w=160&h=160&q=80",
          "alt": "Portrait of Adaeze Nwosu"
        }
      },
      "nextCohort": "4 Nov",
      "badge": "New cohort"
    },
    {
      "title": "Python for Analysts",
      "href": "/courses/python-for-analysts",
      "topic": "Data",
      "level": "intermediate",
      "format": "self-paced",
      "summary": "Clean, join and summarise tables with pandas, then automate the report you rebuild every Monday.",
      "cover": {
        "src": "https://images.unsplash.com/photo-1531482615713-2afd69097998?auto=format&fit=crop&w=800&h=600&q=80",
        "alt": "Two learners leaning over a laptop, reviewing code together"
      },
      "weeks": 5,
      "lessons": 38,
      "price": 260,
      "rating": {
        "value": 4.7,
        "count": 1290
      },
      "instructor": {
        "name": "Adaeze Nwosu",
        "portrait": {
          "src": "https://images.unsplash.com/photo-1531123897727-8f129e1688ce?auto=format&fit=crop&crop=faces&w=160&h=160&q=80",
          "alt": "Portrait of Adaeze Nwosu"
        }
      }
    }
  ],
  "cardLabels": {
    "levels": {
      "beginner": "Beginner",
      "intermediate": "Intermediate",
      "advanced": "Advanced"
    },
    "formats": {
      "cohort": "Live cohort",
      "self-paced": "Self-paced"
    },
    "lessons": "{count} lessons",
    "weeks": "{count} weeks",
    "free": "Free",
    "nextCohort": "Starts {date}",
    "reviews": "{count} reviews"
  }
}