Learning path with milestones and certificatelearning-path-steps
Use in Plus UI
npx shadcn@latest add https://blocks.plusui.com/r/learning-path-steps.jsonProcess & steps · 6 variants
← → to step through · + on a thumbnail to compare side by side (up to 3)

/preview/learning-path-steps
Open ↗Default content
{
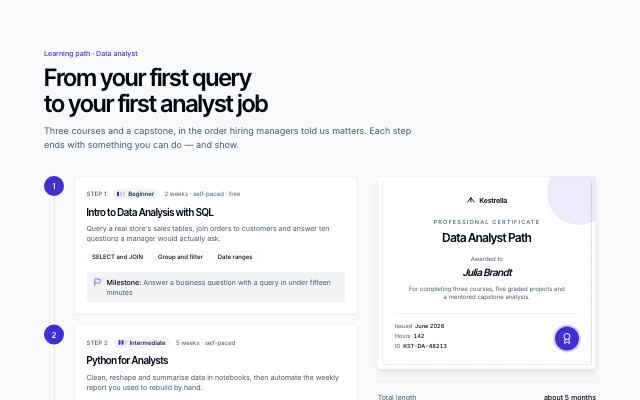
  "eyebrow": "Learning path · Data analyst",
  "title": "From your first query to your first analyst job",
  "description": "Three courses and a capstone, in the order hiring managers told us matters. Each step ends with something you can do — and show.",
  "levelLabels": {
    "beginner": "Beginner",
    "intermediate": "Intermediate",
    "advanced": "Advanced"
  },
  "stepLabel": "Step {n}",
  "milestoneLabel": "Milestone",
  "steps": [
    {
      "title": "Intro to Data Analysis with SQL",
      "href": "/courses/intro-to-sql",
      "level": "beginner",
      "length": "2 weeks · self-paced · free",
      "description": "Query a real store's sales tables, join orders to customers and answer ten questions a manager would actually ask.",
      "skills": [
        "SELECT and JOIN",
        "Group and filter",
        "Date ranges"
      ],
      "milestone": "Answer a business question with a query in under fifteen minutes"
    },
    {
      "title": "Python for Analysts",
      "href": "/courses/python-for-analysts",
      "level": "intermediate",
      "length": "5 weeks · self-paced",
      "description": "Clean, reshape and summarise data in notebooks, then automate the weekly report you used to rebuild by hand.",
      "skills": [
        "pandas",
        "Notebooks",
        "Automation"
      ],
      "milestone": "Turn a messy export into a clean, repeatable report"
    },
    {
      "title": "Data Visualization: Charts That Explain",
      "href": "/courses/data-visualization",
      "level": "intermediate",
      "length": "6 weeks · live cohort",
      "description": "Pick the right chart, annotate it and sequence five charts into a story stakeholders act on.",
      "skills": [
        "Chart choice",
        "Annotation",
        "Storytelling"
      ],
      "milestone": "Present a five-chart story to a room in ten minutes"
    },
    {
      "title": "Capstone: an analysis for a real team",
      "href": "#",
      "level": "advanced",
      "length": "4 weeks · mentored",
      "description": "Work with one of our partner companies on an open question, from data request to final presentation, with a mentor reviewing every step.",
      "skills": [
        "Scoping",
        "Stakeholders",
        "Portfolio"
      ],
      "milestone": "A portfolio case study and a reference from a working team"
    }
  ],
  "finish": {
    "label": "Job-ready",
    "text": "68% of path graduates moved into an analyst role within six months of finishing."
  },
  "summary": [
    {
      "label": "Total length",
      "value": "about 5 months"
    },
    {
      "label": "Weekly effort",
      "value": "6–8 hours"
    },
    {
      "label": "Path price",
      "value": "$690, or $79 a month"
    }
  ],
  "certificate": {
    "brand": "kestrella",
    "kind": "Professional certificate",
    "title": "Data Analyst Path",
    "holderLabel": "Awarded to",
    "holder": "Julia Brandt",
    "detail": "For completing three courses, five graded projects and a mentored capstone analysis.",
    "facts": [
      {
        "label": "Issued",
        "value": "June 2026"
      },
      {
        "label": "Hours",
        "value": "142"
      },
      {
        "label": "ID",
        "value": "KST-DA-48213"
      }
    ]
  },
  "action": {
    "label": "Start the path free",
    "href": "#",
    "variant": "primary"
  }
}