Figures over a full-bleed photostats-photo-overlay
Use in Plus UI
npx shadcn@latest add https://blocks.plusui.com/r/stats-photo-overlay.jsonStats · 9 variants
← → to step through · + on a thumbnail to compare side by side (up to 3)

/preview/stats-photo-overlay
Open ↗Default content
{
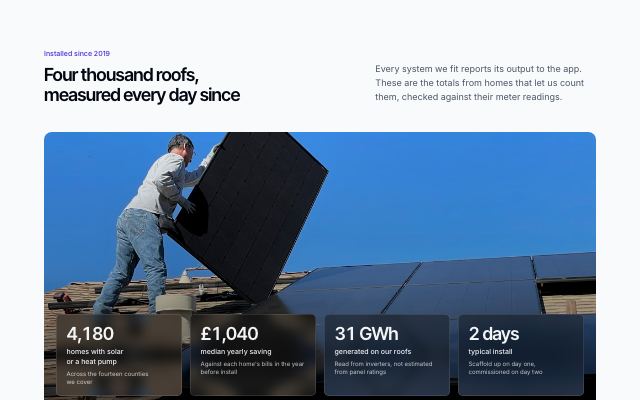
  "eyebrow": "Installed since 2019",
  "title": "Four thousand roofs, measured every day since",
  "description": "Every system we fit reports its output to the app. These are the totals from homes that let us count them, checked against their meter readings.",
  "image": {
    "src": "https://images.unsplash.com/photo-1624397640148-949b1732bb0a?auto=format&fit=crop&w=2000&h=1000&q=80",
    "alt": "Two installers fixing solar panels to a pitched roof on a clear day"
  },
  "metrics": [
    {
      "value": "4,180",
      "label": "homes with solar or a heat pump",
      "context": "Across the fourteen counties we cover"
    },
    {
      "value": "£1,040",
      "label": "median yearly saving",
      "context": "Against each home's bills in the year before install"
    },
    {
      "value": "31 GWh",
      "label": "generated on our roofs",
      "context": "Read from inverters, not estimated from panel ratings"
    },
    {
      "value": "2 days",
      "label": "typical install",
      "context": "Scaffold up on day one, commissioned on day two"
    }
  ]
}