Metrics beside a trend chartstats-split-chart
Use in Plus UI
npx shadcn@latest add https://blocks.plusui.com/r/stats-split-chart.jsonStats · 9 variants
← → to step through · + on a thumbnail to compare side by side (up to 3)
/preview/stats-split-chart
Open ↗Default content
{
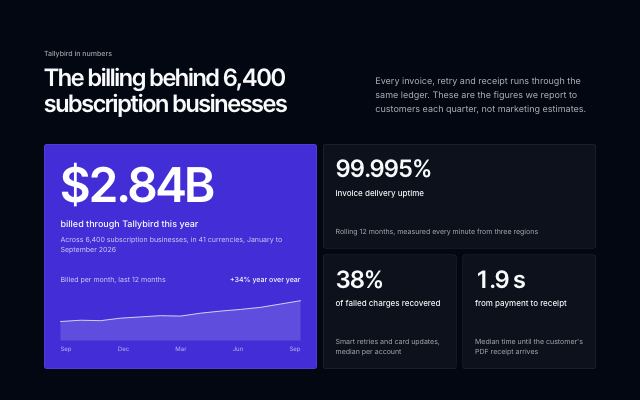
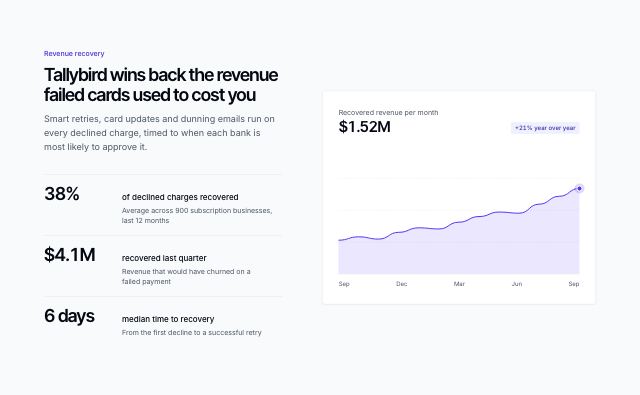
  "eyebrow": "Revenue recovery",
  "title": "Tallybird wins back the revenue failed cards used to cost you",
  "description": "Smart retries, card updates and dunning emails run on every declined charge, timed to when each bank is most likely to approve it.",
  "metrics": [
    {
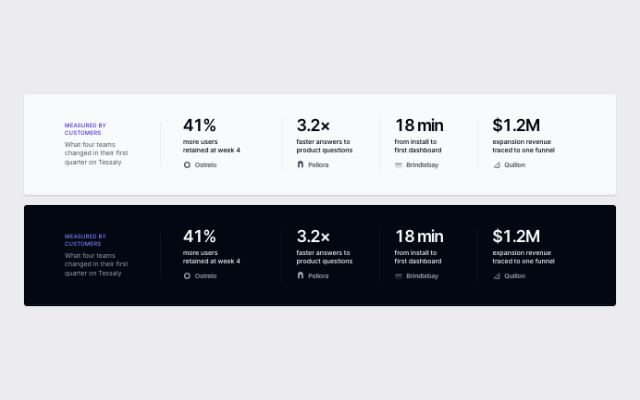
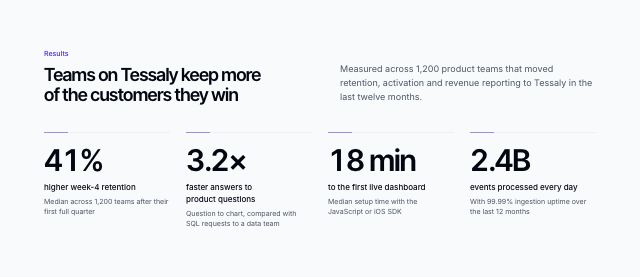
      "value": "38%",
      "label": "of declined charges recovered",
      "context": "Average across 900 subscription businesses, last 12 months"
    },
    {
      "value": "$4.1M",
      "label": "recovered last quarter",
      "context": "Revenue that would have churned on a failed payment"
    },
    {
      "value": "6 days",
      "label": "median time to recovery",
      "context": "From the first decline to a successful retry"
    }
  ],
  "chart": {
    "title": "Recovered revenue per month",
    "value": "$1.52M",
    "delta": "+21% year over year",
    "points": [
      30,
      33,
      31,
      37,
      41,
      40,
      46,
      51,
      55,
      54,
      62,
      69,
      76
    ],
    "labels": [
      "Sep",
      "Dec",
      "Mar",
      "Jun",
      "Sep"
    ]
  }
}