AI usage and cost dashboardmetrics-dashboard-ai-usage
Use in Plus UI
npx shadcn@latest add https://blocks.plusui.com/r/metrics-dashboard-ai-usage.jsonMetrics-dashboard · 8 variants
← → to step through · + on a thumbnail to compare side by side (up to 3)
/preview/metrics-dashboard-ai-usage
Open ↗Default content
{
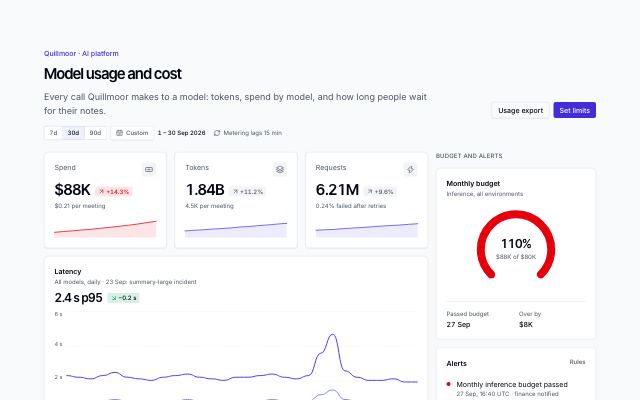
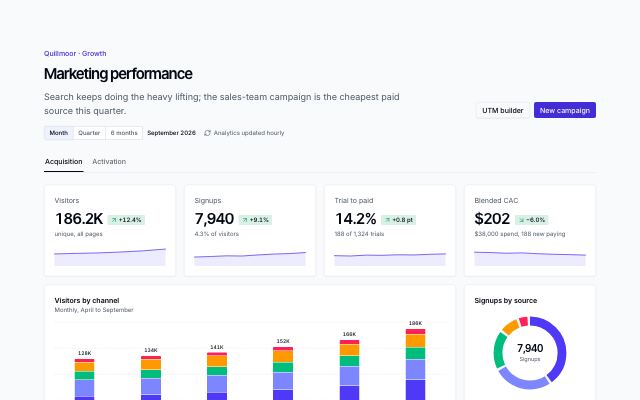
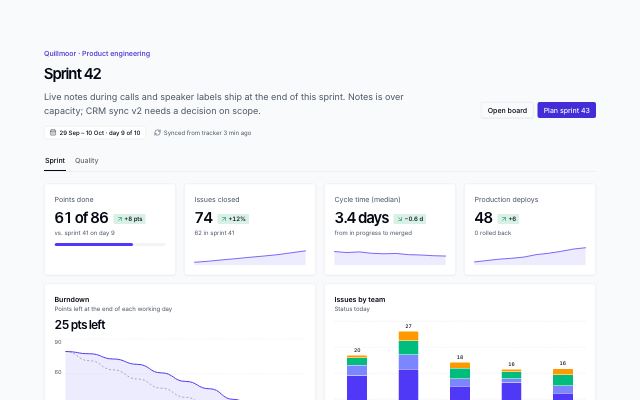
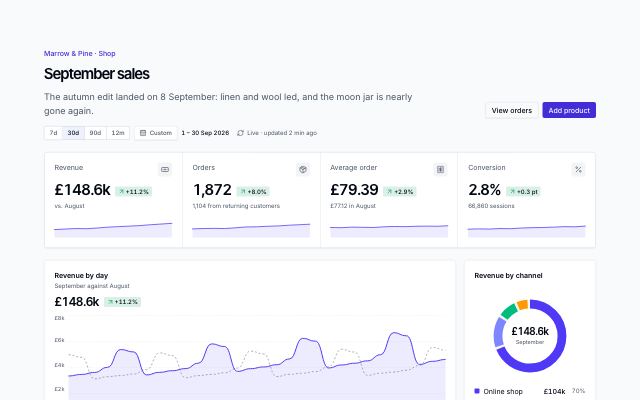
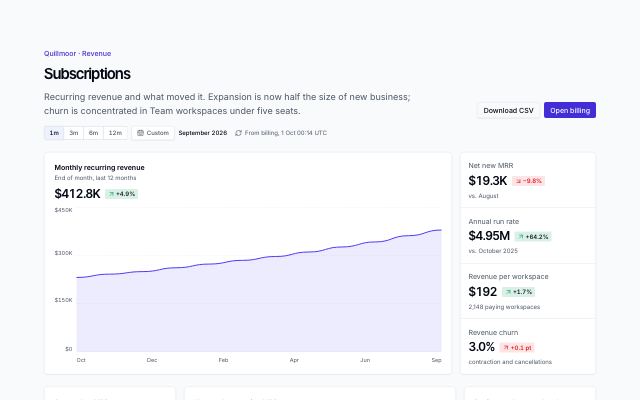
"eyebrow": "Quillmoor · AI platform",
"title": "Model usage and cost",
"description": "Every call Quillmoor makes to a model: tokens, spend by model, and how long people wait for their notes.",
"range": {
"label": "Period",
"base": 1,
"presets": [
{
"label": "7d",
"days": 7,
"period": "24 – 30 Sep 2026"
},
{
"label": "30d",
"days": 30,
"period": "1 – 30 Sep 2026"
},
{
"label": "90d",
"days": 92,
"period": "1 Jul – 30 Sep 2026"
}
],
"custom": {
"label": "Custom",
"title": "Pick a start and end day",
"apply": "Apply",
"cancel": "Cancel",
"min": "2026-07-01",
"max": "2026-09-30"
}
},
"updated": "Metering lags 15 min",
"actions": [
{
"label": "Usage export",
"variant": "secondary"
},
{
"label": "Set limits",
"variant": "primary"
}
],
"loadingLabel": "Loading usage",
"empty": {
"title": "No model calls in this period",
"description": "Usage is metered from the first request a workspace makes in the range."
},
"asideTitle": "Budget and alerts",
"widgets": [
{
"kind": "kpi",
"title": "Spend",
"span": 1,
"icon": "cash",
"value": "$88.0K",
"delta": {
"value": "+14.3%",
"direction": "up",
"sentiment": "negative"
},
"context": "$0.21 per meeting",
"trend": [
22,
27,
31,
36,
40,
46,
51,
57,
63,
70,
78,
86
],
"byRange": {
"7d": {
"value": "$19.6K",
"delta": {
"value": "−10.5%",
"direction": "down",
"sentiment": "positive"
},
"context": "$0.20 per meeting",
"trend": [
84,
80,
72,
70,
71,
69,
68
]
},
"90d": {
"value": "$244.1K",
"delta": {
"value": "+42.3%",
"direction": "up",
"sentiment": "negative"
},
"context": "$0.21 per meeting",
"trend": [
30,
33,
35,
38,
41,
44,
47,
52,
56,
61,
66,
74,
86
]
}
}
},
{
"kind": "kpi",
"title": "Tokens",
"span": 1,
"icon": "layers",
"value": "1.84B",
"delta": {
"value": "+11.2%",
"direction": "up",
"sentiment": "neutral"
},
"context": "4.5K per meeting",
"trend": [
30,
34,
37,
41,
44,
48,
53,
56,
61,
65,
70,
74
],
"byRange": {
"7d": {
"value": "461M",
"delta": {
"value": "+2.9%",
"direction": "up",
"sentiment": "neutral"
},
"context": "4.7K per meeting",
"trend": [
66,
70,
68,
71,
72,
73,
74
]
},
"90d": {
"value": "5.07B",
"delta": {
"value": "+40.1%",
"direction": "up",
"sentiment": "neutral"
},
"context": "4.5K per meeting",
"trend": [
38,
40,
43,
45,
47,
50,
53,
55,
58,
62,
66,
70,
74
]
}
}
},
{
"kind": "kpi",
"title": "Requests",
"span": 1,
"icon": "zap",
"value": "6.21M",
"delta": {
"value": "+9.6%",
"direction": "up",
"sentiment": "neutral"
},
"context": "0.24% failed after retries",
"trend": [
34,
37,
39,
44,
47,
50,
54,
58,
61,
64,
68,
72
],
"byRange": {
"7d": {
"value": "1.52M",
"delta": {
"value": "+3.4%",
"direction": "up",
"sentiment": "neutral"
},
"context": "0.11% failed after retries",
"trend": [
64,
68,
66,
69,
70,
71,
72
]
},
"90d": {
"value": "17.3M",
"delta": {
"value": "+34.1%",
"direction": "up",
"sentiment": "neutral"
},
"context": "0.21% failed after retries",
"trend": [
40,
42,
45,
47,
49,
52,
54,
57,
60,
62,
65,
68,
72
]
}
}
},
{
"kind": "line",
"title": "Latency",
"span": 3,
"caption": "All models, daily · 23 Sep: summary-large incident",
"value": "2.4 s p95",
"delta": {
"value": "−0.2 s",
"direction": "down",
"sentiment": "positive"
},
"byRange": {
"7d": {
"caption": "All models, daily · the week after the incident",
"value": "2.2 s p95",
"delta": {
"value": "−1.3 s",
"direction": "down",
"sentiment": "positive"
}
}
},
"chart": {
"series": [
{
"label": "p95",
"points": [
41.7,
40,
38.3,
41.7,
45,
40,
38.3,
36.7,
40,
41.7,
43.3,
40,
38.3,
36.7,
40,
40,
41.7,
43.3,
40,
38.3,
41.7,
65,
85,
46.7,
40,
36.7,
36.7,
38.3,
35,
35
]
},
{
"label": "p50",
"points": [
15,
15,
13.3,
15,
16.7,
15,
15,
13.3,
15,
15,
16.7,
15,
15,
13.3,
15,
15,
15,
16.7,
15,
15,
15,
21.7,
26.7,
16.7,
15,
13.3,
13.3,
15,
13.3,
13.3
]
}
],
"labels": [
"1 Sep",
"8 Sep",
"15 Sep",
"22 Sep",
"30 Sep"
],
"ticks": [
"6 s",
"4 s",
"2 s",
"0 s"
]
}
},
{
"kind": "stacked",
"title": "Tokens by model",
"span": 2,
"caption": "Weekly",
"period": "fixed",
"chart": {
"series": [
"summary-large",
"transcribe-v3",
"actions-small",
"embed-2",
"rerank-1"
],
"columns": [
{
"label": "25 Aug",
"value": "372M",
"values": [
24.6,
20.1,
16.4,
11.2,
2.2
]
},
{
"label": "1 Sep",
"value": "398M",
"values": [
26.3,
21.5,
17.5,
11.9,
2.4
]
},
{
"label": "8 Sep",
"value": "421M",
"values": [
27.8,
22.7,
18.5,
12.6,
2.5
]
},
{
"label": "15 Sep",
"value": "436M",
"values": [
28.8,
23.5,
19.2,
13.1,
2.6
]
},
{
"label": "22 Sep",
"value": "448M",
"values": [
29.6,
24.2,
19.7,
13.4,
2.7
]
},
{
"label": "29 Sep",
"value": "461M",
"values": [
30.4,
24.9,
20.3,
13.8,
2.8
]
}
]
}
},
{
"kind": "donut",
"title": "Spend by model",
"span": 1,
"period": "fixed",
"chart": {
"value": "$88.0K",
"caption": "September",
"segments": [
{
"label": "summary-large",
"value": "$41.2K",
"share": 46.81818181818182
},
{
"label": "transcribe-v3",
"value": "$27.5K",
"share": 31.25
},
{
"label": "actions-small",
"value": "$9.6K",
"share": 10.909090909090908
},
{
"label": "embed-2",
"value": "$5.1K",
"share": 5.795454545454545
},
{
"label": "rerank-1",
"value": "$4.6K",
"share": 5.227272727272727
}
]
}
},
{
"kind": "table",
"title": "Models",
"span": 3,
"caption": "September",
"period": "fixed",
"link": {
"label": "Routing rules"
},
"columns": [
{
"label": "Model"
},
{
"label": "Requests",
"align": "end"
},
{
"label": "Tokens",
"align": "end"
},
{
"label": "Cost",
"align": "end"
},
{
"label": "p95",
"align": "end"
},
{
"label": "Errors",
"align": "end"
}
],
"rows": [
{
"cells": [
{
"text": "summary-large",
"sub": "Meeting summaries",
"mono": true
},
"1.02M",
"612M",
"$41,200",
"4.8 s",
{
"text": "0.4%",
"tone": "warning"
}
]
},
{
"cells": [
{
"text": "transcribe-v3",
"sub": "Transcription",
"mono": true
},
"2.31M",
"488M",
"$27,500",
"1.9 s",
"0.3%"
]
},
{
"cells": [
{
"text": "actions-small",
"sub": "Action items",
"mono": true
},
"1.24M",
"402M",
"$9,600",
"1.1 s",
"0.2%"
]
},
{
"cells": [
{
"text": "embed-2",
"sub": "Search index",
"mono": true
},
"1.38M",
"286M",
"$5,100",
"0.3 s",
"0.0%"
]
},
{
"cells": [
{
"text": "rerank-1",
"sub": "Search ranking",
"mono": true
},
"260K",
"52M",
"$4,600",
"0.6 s",
"0.1%"
]
}
]
},
{
"kind": "radial",
"title": "Monthly budget",
"span": 1,
"aside": true,
"caption": "Inference, all environments",
"period": "fixed",
"tone": "destructive",
"gauge": {
"value": "110%",
"caption": "$88.0K of $80.0K",
"progress": 100
},
"facts": [
{
"label": "Passed budget",
"value": "27 Sep"
},
{
"label": "Over by",
"value": "$8.0K"
}
]
},
{
"kind": "list",
"title": "Alerts",
"span": 1,
"aside": true,
"period": "fixed",
"link": {
"label": "Rules"
},
"empty": {
"title": "No alerts",
"description": "Budgets, latency and error rates are all inside their limits."
},
"items": [
{
"title": "Monthly inference budget passed",
"meta": "27 Sep, 16:40 UTC · finance notified",
"tone": "danger"
},
{
"title": "summary-large p95 above 4.5 s for 3 h",
"meta": "23 Sep · failover to the secondary region",
"tone": "warning"
},
{
"title": "transcribe-v3 retries back under 0.5%",
"meta": "24 Sep · resolved",
"tone": "success"
},
{
"title": "Embedding cache hit rate at 71%",
"meta": "Steady · target 70%",
"tone": "neutral"
}
]
},
{
"kind": "bars",
"title": "Heaviest workspaces",
"span": 1,
"aside": true,
"caption": "Tokens this month",
"period": "fixed",
"items": [
{
"label": "Brindlebay Health",
"value": "48.2M",
"share": 100
},
{
"label": "Pellora",
"value": "31.5M",
"share": 65
},
{
"label": "Mosswell Logistics",
"value": "22.9M",
"share": 48
},
{
"label": "Zephlo",
"value": "19.4M",
"share": 40
}
]
}
]
}