Marketing analytics dashboardmetrics-dashboard-marketing
Use in Plus UI
npx shadcn@latest add https://blocks.plusui.com/r/metrics-dashboard-marketing.jsonMetrics-dashboard · 8 variants
← → to step through · + on a thumbnail to compare side by side (up to 3)
/preview/metrics-dashboard-marketing
Open ↗Default content
{
"eyebrow": "Quillmoor · Growth",
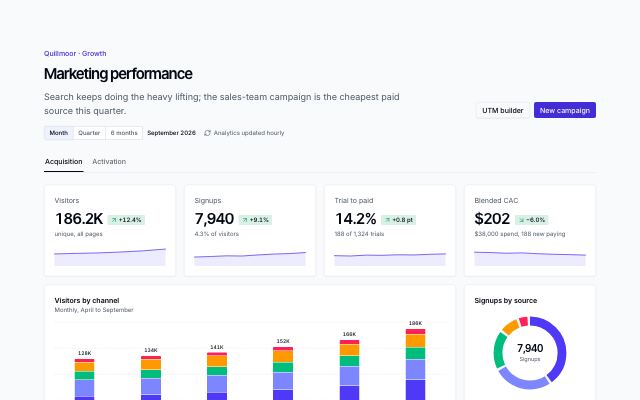
"title": "Marketing performance",
"description": "Search keeps doing the heavy lifting; the sales-team campaign is the cheapest paid source this quarter.",
"range": {
"label": "Period",
"presets": [
{
"label": "Month",
"days": 30,
"period": "September 2026"
},
{
"label": "Quarter",
"days": 92,
"period": "Q3 2026 · Jul – Sep"
},
{
"label": "6 months",
"days": 183,
"period": "Apr – Sep 2026"
}
]
},
"updated": "Analytics updated hourly",
"actions": [
{
"label": "UTM builder",
"variant": "secondary"
},
{
"label": "New campaign",
"variant": "primary"
}
],
"loadingLabel": "Loading analytics",
"empty": {
"title": "No visits in this period",
"description": "Traffic shows up here an hour after the tracking snippet sees its first visit."
},
"tabs": {
"label": "Dashboard views",
"items": [
"Acquisition",
"Activation"
]
},
"widgets": [
{
"kind": "kpi",
"title": "Visitors",
"span": 1,
"value": "186.2K",
"delta": {
"value": "+12.4%",
"direction": "up",
"sentiment": "positive"
},
"context": "unique, all pages",
"trend": [
62,
65,
68,
73,
80,
90
],
"byRange": {
"Quarter": {
"value": "503.8K",
"delta": {
"value": "+24.8%",
"direction": "up",
"sentiment": "positive"
},
"context": "vs. April to June"
},
"6 months": {
"value": "907.6K",
"delta": {
"value": "+27.5%",
"direction": "up",
"sentiment": "positive"
},
"context": "vs. the six months before"
}
}
},
{
"kind": "kpi",
"title": "Signups",
"span": 1,
"value": "7,940",
"delta": {
"value": "+9.1%",
"direction": "up",
"sentiment": "positive"
},
"context": "4.3% of visitors",
"trend": [
44,
47,
51,
50,
56,
61,
64,
70
],
"byRange": {
"Quarter": {
"value": "21,610",
"delta": {
"value": "+20.9%",
"direction": "up",
"sentiment": "positive"
},
"context": "4.3% of visitors"
},
"6 months": {
"value": "38,410",
"delta": {
"value": "+29.3%",
"direction": "up",
"sentiment": "positive"
},
"context": "4.2% of visitors"
}
}
},
{
"kind": "kpi",
"title": "Trial to paid",
"span": 1,
"value": "14.2%",
"delta": {
"value": "+0.8 pt",
"direction": "up",
"sentiment": "positive"
},
"context": "188 of 1,324 trials",
"trend": [
52,
50,
55,
54,
57,
56,
60,
62
],
"byRange": {
"Quarter": {
"value": "13.9%",
"delta": {
"value": "+1.1 pt",
"direction": "up",
"sentiment": "positive"
},
"context": "512 of 3,684 trials"
},
"6 months": {
"value": "13.4%",
"delta": {
"value": "+1.6 pt",
"direction": "up",
"sentiment": "positive"
},
"context": "931 of 6,948 trials"
}
}
},
{
"kind": "kpi",
"title": "Blended CAC",
"span": 1,
"value": "$202",
"delta": {
"value": "−6.0%",
"direction": "down",
"sentiment": "positive"
},
"context": "$38,000 spend, 188 new paying",
"trend": [
72,
70,
66,
68,
63,
60,
58,
55
],
"byRange": {
"Quarter": {
"value": "$214",
"delta": {
"value": "−9%",
"direction": "down",
"sentiment": "positive"
},
"context": "$109,600 spend, 512 new paying"
},
"6 months": {
"value": "$229",
"delta": {
"value": "−12%",
"direction": "down",
"sentiment": "positive"
},
"context": "$213,200 spend, 931 new paying"
}
}
},
{
"kind": "stacked",
"title": "Visitors by channel",
"span": 3,
"caption": "Monthly, April to September",
"period": "fixed",
"chart": {
"series": [
"Organic search",
"Direct",
"Referral",
"Paid",
"Newsletter"
],
"columns": [
{
"label": "Apr",
"value": "128K",
"values": [
28.2,
15.4,
7.7,
8.3,
4.5
]
},
{
"label": "May",
"value": "134K",
"values": [
29.5,
15.4,
8,
9.4,
4.7
]
},
{
"label": "Jun",
"value": "141K",
"values": [
31.8,
16.2,
7.8,
9.9,
4.9
]
},
{
"label": "Jul",
"value": "152K",
"values": [
34.2,
16.7,
9.1,
10.6,
5.3
]
},
{
"label": "Aug",
"value": "166K",
"values": [
38.1,
18.2,
9.9,
10.8,
5.8
]
},
{
"label": "Sep",
"value": "186K",
"values": [
43.8,
19.6,
11.2,
12.1,
6.5
]
}
]
}
},
{
"kind": "donut",
"title": "Signups by source",
"span": 1,
"chart": {
"value": "7,940",
"caption": "Signups",
"segments": [
{
"label": "Organic search",
"value": "3,255",
"share": 40.994962216624685
},
{
"label": "Teammate invites",
"value": "2,144",
"share": 27.00251889168766
},
{
"label": "Paid",
"value": "1,429",
"share": 17.997481108312343
},
{
"label": "Referral",
"value": "715",
"share": 9.005037783375315
},
{
"label": "Other",
"value": "397",
"share": 5
}
]
}
},
{
"kind": "table",
"title": "Campaigns",
"span": 3,
"caption": "Paid and owned, September",
"link": {
"label": "All campaigns"
},
"columns": [
{
"label": "Campaign"
},
{
"label": "Spend",
"align": "end"
},
{
"label": "Signups",
"align": "end"
},
{
"label": "Per signup",
"align": "end"
},
{
"label": "8 weeks"
}
],
"rows": [
{
"cells": [
{
"text": "Meeting notes for sales teams",
"sub": "Paid search"
},
"$9,800",
"1,140",
"$8.60",
{
"text": "",
"trend": [
30,
34,
41,
39,
48,
55,
61,
66
]
}
]
},
{
"cells": [
{
"text": "Ops leaders, lookalike audience",
"sub": "Paid social"
},
"$10,600",
"890",
"$11.91",
{
"text": "",
"trend": [
44,
40,
47,
52,
49,
55,
58,
60
]
}
]
},
{
"cells": [
{
"text": "Q3 product webinar",
"sub": "Webinar"
},
"$2,400",
"620",
"$3.87",
{
"text": "",
"trend": [
10,
12,
15,
22,
64,
80,
34,
20
]
}
]
},
{
"cells": [
{
"text": "Podcast sponsorships",
"sub": "Audio"
},
"$8,000",
"380",
"$21.05",
{
"text": "",
"trend": [
20,
24,
22,
27,
25,
30,
29,
31
]
}
]
},
{
"cells": [
{
"text": "Friday recap newsletter",
"sub": "Newsletter"
},
"$600",
"410",
"$1.46",
{
"text": "",
"trend": [
38,
41,
40,
44,
47,
46,
50,
53
]
}
]
}
]
},
{
"kind": "bars",
"title": "Top landing pages",
"span": 1,
"caption": "Visits",
"items": [
{
"label": "/ai-meeting-notes",
"value": "41.8K",
"share": 100
},
{
"label": "/templates/one-on-one",
"value": "22.6K",
"share": 54.066985645933016
},
{
"label": "/pricing",
"value": "18.9K",
"share": 45.21531100478469
},
{
"label": "/integrations/calendar",
"value": "12.4K",
"share": 29.665071770334926
},
{
"label": "/blog/async-standups",
"value": "9.7K",
"share": 23.205741626794257
}
]
},
{
"kind": "kpi",
"title": "Activated",
"span": 1,
"tab": 1,
"value": "69%",
"delta": {
"value": "+3 pt",
"direction": "up",
"sentiment": "positive"
},
"context": "recorded a meeting in week one"
},
{
"kind": "kpi",
"title": "Time to first meeting",
"span": 1,
"tab": 1,
"value": "1.8 days",
"delta": {
"value": "−0.4 d",
"direction": "down",
"sentiment": "positive"
},
"context": "median, from signup"
},
{
"kind": "kpi",
"title": "Invites per workspace",
"span": 1,
"tab": 1,
"value": "2.6",
"delta": {
"value": "+0.3",
"direction": "up",
"sentiment": "positive"
},
"context": "in the first 14 days"
},
{
"kind": "kpi",
"title": "Trials started",
"span": 1,
"tab": 1,
"value": "1,324",
"delta": {
"value": "+7.4%",
"direction": "up",
"sentiment": "positive"
},
"context": "16.7% of signups",
"byRange": {
"Quarter": {
"value": "3,684",
"delta": {
"value": "+11.8%",
"direction": "up",
"sentiment": "positive"
},
"context": "17.0% of signups"
},
"6 months": {
"value": "6,948",
"delta": {
"value": "+16.3%",
"direction": "up",
"sentiment": "positive"
},
"context": "18.1% of signups"
}
}
},
{
"kind": "funnel",
"title": "Signup to paid",
"span": 2,
"tab": 1,
"caption": "7,940 September signups",
"chart": {
"steps": [
{
"label": "Signed up",
"value": 100
},
{
"label": "First meeting",
"value": 69
},
{
"label": "Shared a note",
"value": 44
},
{
"label": "Invited a teammate",
"value": 31
},
{
"label": "Started a trial",
"value": 16.7
},
{
"label": "Paid",
"value": 2.4
}
]
}
},
{
"kind": "cohort",
"title": "Weekly retention by signup week",
"span": 2,
"tab": 1,
"caption": "Share still recording meetings",
"period": "fixed",
"chart": {
"columns": [
"W0",
"W1",
"W2",
"W3",
"W4",
"W5"
],
"rows": [
{
"label": "11 Aug",
"values": [
100,
71,
62,
57,
54,
52
]
},
{
"label": "18 Aug",
"values": [
100,
73,
63,
58,
55,
53
]
},
{
"label": "25 Aug",
"values": [
100,
72,
64,
59,
56
]
},
{
"label": "1 Sep",
"values": [
100,
75,
66,
61
]
},
{
"label": "8 Sep",
"values": [
100,
77,
68
]
},
{
"label": "15 Sep",
"values": [
100,
78
]
}
]
}
}
]
}